September 16, 2002
Mike Engle is a cell biologist in his postdoctoral fellowship. He uses eComStation in his research on ADAMTS proteinases. He has been using OS/2 since version 2.0 and has never found anything better.
If you have a comment about the content of this article, please feel free to vent in the OS/2 eZine discussion forums.
There is also a Printer Friendly version of this page.
|
Previous Article |
|
Next Article |

Xact
I have wanted to purchase a program for quite a long time but the cost has inhibited me. I picked up a part time teaching gig at a local community college. With the extra income I rewarded myself by purchasing Xact, a scientific graphing program. It is unlike gnu-plot or Mathmatica which create graphs based on formula data. Instead Xact makes graphs from numbers you provide in its spreadsheet. I am a cell biologist and while much of the data I generate consists of pictures another significant part is composed of numerical data which needs to be presented in graphical form. I want my data to be presented in the most understandable format so I am a bit particular in how my graphs look. Xact gives me the control I want to generate graphs the way I want them to look.
Entering Data
Xact starts with a spreadsheet in which you enter your numerical data. Xact is column based, meaning that each column is a different part of your graph. That doesn't mean that you have to graph every column. You can enter a column of data and then use a formula (entered in the top most part of the column) to alter the data and place it in a different column. While not the same as Mesa or 1-2-3 you can use functions such as: SIN, DEG, RAD, ABS, SQRT, CUM(C1), SUM (C1:C5), and LINK (to another Xact worksheet column). Constants include: E, PI, LINE. Operations include: +, -, *, /, and ^. Most of the time my data requires more involved processing than I can do in Xact so usually I put my data in 1-2-3 first, run my calculations, and then copy and paste the final numbers I want graphed into Xact. Another reason for using 1-2-3 is that I often want my data organized so I can print it out and look at it all at once, which does not usually fit into the column only format of Xact. Xact can import Xact tables, ASCII or Text, Print files, CSV (comma separated values), CSV (Semicolon instead of comma), CSV (List separator), DIF format, Lotus 1-2-3, Lotus Symphony, Dbase (III, III+, IV), MS-Excel (4.0), and IBM Works tables.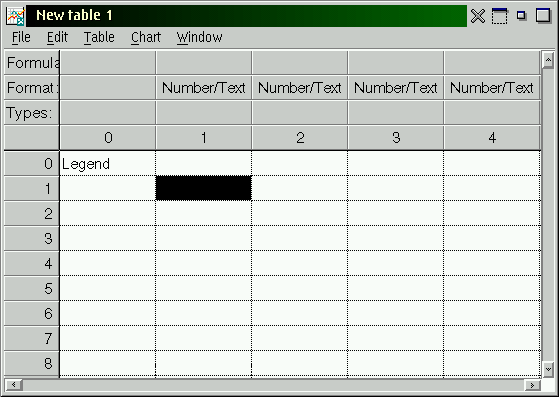
Ease of Use starts with the Spreadsheet
I have used several different graphing programs including, Sigma Plot, Origin, and CoPlot but none come close to Xact's ease of use. In fact, Xact is the first program that I have used where I have not ended up swearing at the computer because I can't get the look I want. In fact, Xact is a program I sit an undergraduate down to and in a very short time have a good looking graph that is correctly annotated. This ease of use was worth every penny. The first ease of use comes from the box near the top of the column labeled "Types:". By clicking on the box you can designate what part of the graph that column of data will be. By looking at figure 2 you can see that I designated column 1 as the Left Y axis; column 2 as Bottom X axis; column 3 as Left Y axis above or "+" standard deviation only; column 4 Right Y axis; and column 5 Right Y axis both above and below standard deviation. When using other programs like Origin you can't designate which part of the graph is which column until you select the graph function, which often opens up another window obscuring your data so you have to remember which column is which.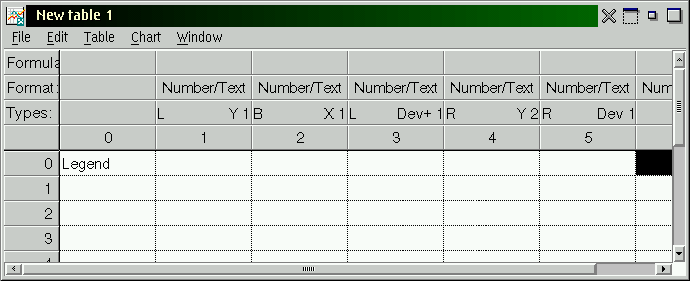
Graph Types
As you would expect from a professional graphing program you have so many choices of graph types along with subtypes to choose from. For example, Figure 3 shows your choices when you choose bar graphs. From the Chart menu you can select the chart types: Lines, Ribbons, Bars, Pies, Tables charts, Stock charts, Lines-3D, Surface/contour plots, Profile, Polar plots, and Special. When you do create a graph, Xact opens another window with the graph in it. Unlike Origin, Xact saves the table and graph in separate files. One of my small complaints of Xact is that saved files are not as OS/2 as I would like. Xact uses the dot three extension. Tables are saved as a .XTF file and the graph is saved as a .XGF file. A bummer is that both the .XTF and .XGF files have the same icon, which means that if you save the data and the graph with the same name you have to be careful and read the names closely to tell which is which.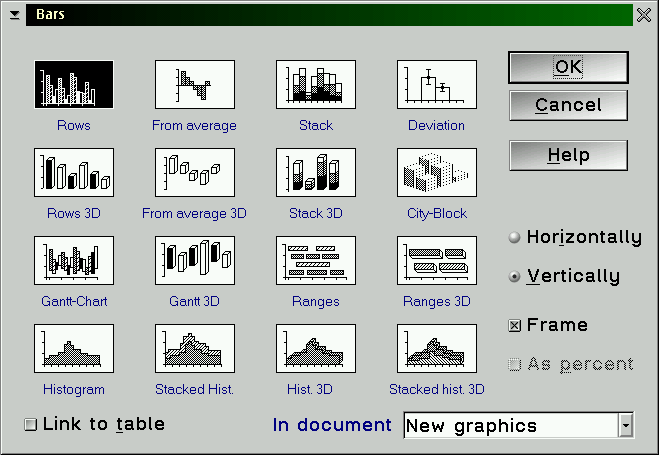
![]()
Modifying the Graph
As you would expect from a professional package you can click on any item in the graph and modify it. Like any OS/2 program, that mouse click is via button two which then pops up a context sensitive menu. In addition, to move items in the graph window you must use mouse button two. It is so nice to see such an OS/2 program in use. As expected, you can change any component of the graph which gives me the control I want and it is logical to me. I have only had to resort to looking at the manual a few times and each time I have been able to find the answer I needed. By the way, I purchased the educational version which does not come with a printed manual but a portable document file (.pdf) instead. I printed it all out on university paper and put it in a three ring binder. Both the online help and the manual are well organized and helpful. They do strongly encourage that you read at least the beginning of the manual to understand how Xact operates. I must admit I found it helpful when first evaluating the downloadable demo. The translation from German into English is excellent. On the CD is the Windows 16 and 32 bit versions as well as the OS/2 version. I would recommend telling SciLabs that you are using the OS/2 version. We all want to encourage those OS/2 developers as much as we can. Alas you can not register online instead you must register via a mailed post card to Germany. A few of the more advanced graph changeable items I have made use of already include: Left and right Y axes, Split axes, graph placement, standard error bars, and formulas in the table. By having a native OS/2 program, I have access to all my installed OS/2 fonts, something I don't have with the Java CoPlot nor the Win16 Origin.General Drawing
Another important function I must point out is that Xact has wonderful vector drawing abilities. You can see the toolbox in figure 5. While the drawing abilities are not as good as in Draw Out I feel the text editing is better. I could almost write an entire article on the vector drawing abilities of Xact. Xact saves graphs in its own format but can export graphs or drawings in the following formats: Windows Metafile, Windows Clipboard file, OS/2 Metafile, IPS with preview, IPS, Postscript print file, TIFF, Adobe Illustrator 88, Adobe Illustrator 3.0, OS/2 Big-time, Windows Big-time, PBX, GEM 2.0, Gem and UP/GO plot file. One always wants more file formats than available but I would really appreciate a .if or .nag file format. In addition, Xact graphs work in a frame that equals a single page - enabling nice printouts.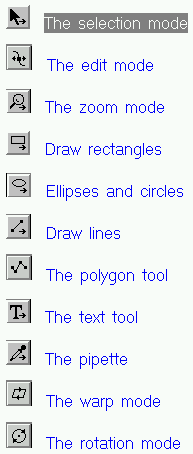
D'oh
I must confess that I needed to use the help more than once. But one time was more embarrassing than others. I am particular about my graphs and I wanted the font in the title to be different than the rest of the graph but I could not figure out how to change it. Upon consulting the help I did a Homer Simpson and said d'oh, it really is an OS/2 program. As you can see in figure 5 there is no button for changing the fonts - that is until you right click on the title text area and you get a pop up menu with lots of options, including fonts.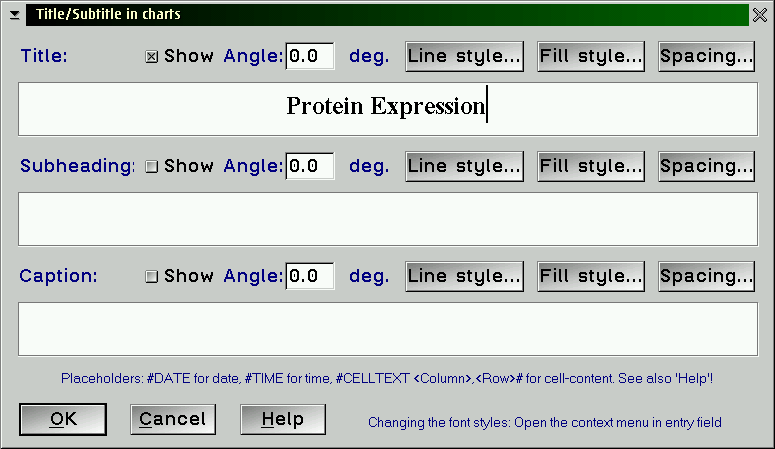
Mathematical Procedures
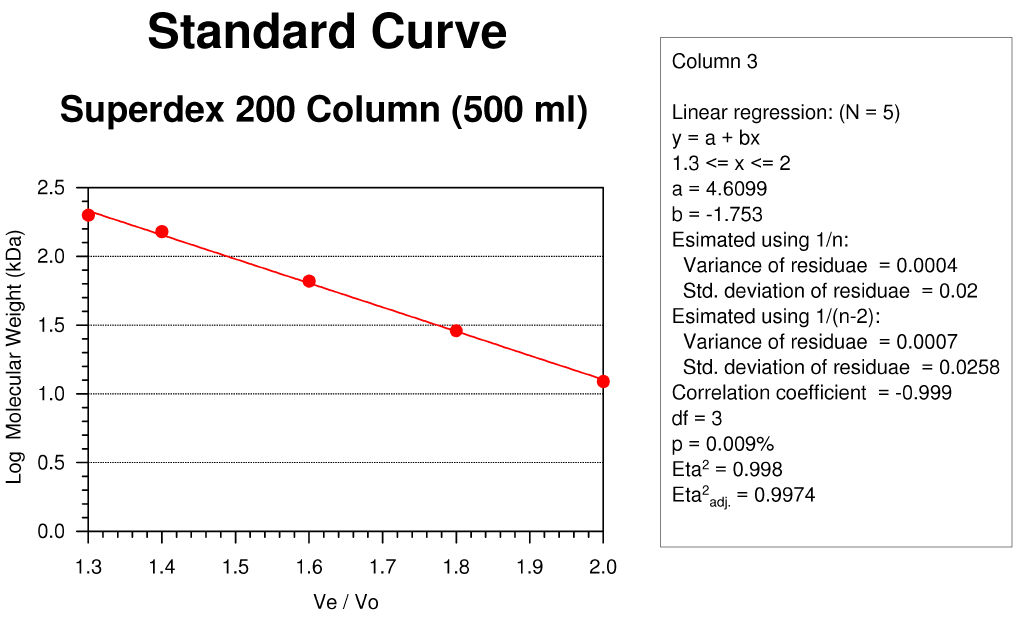
I almost forgot to mention this. What good is a scientific graphing program if it does not do any more than make pretty graphs. It should do some work for you, and Xact does. Once you have a basic line graph you can right click on the graph and select Mathematical Procedures, which opens up a submenu with the options of: Regression/fits, Interpolation, Approximation, Extrapolation, FFT-Filter, Calculate area, Integrate, and Differentiate. Under the Regression/fits is the very popular and useful Linear fit to "fit" a straight line to your data. Below is the dialog window for Regression/fit so you can see the options Xact offers.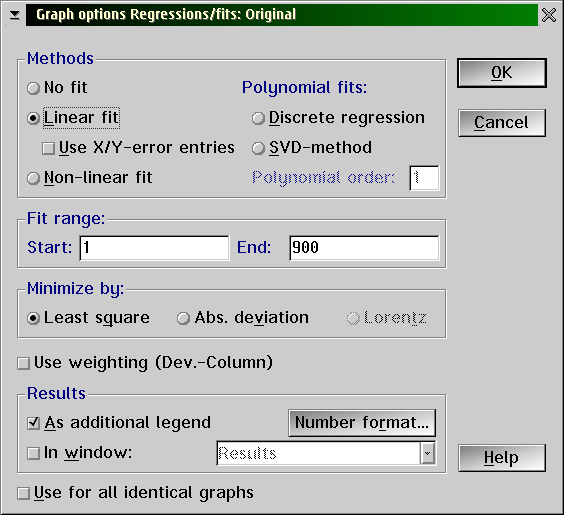
Not only do you get a line through your data, but even more helpful Xact brings up a table with information about the fitted line.
[Click to view full size.]
Contact and Cost
So far I have mentioned the cost of Xact without mentioning numbers. The cost is $499.00 with an educational cost of $399.00. While that may seem quite high it is on par or just below the competition. Now that I finally have the program I think it is worth every penny. You can download a 3.3 Mbyte demo from the Xact web site at www.scilab.de. The pdf manual is 2.6 Mbytes. Both are zipped files. Although it is called version 7 the CD I received is version 7.21f. The company is SciLab GmbH in Hamburg Germany. Their web site leaves much to be desired in terms of content but the basics are there. There is not even a contact link for the company. Since SciLab does not have online purchasing (you have to fax them), I ordered my copy from Mensys (I miss Indelible Blue).Summary
Not only can I sit a university student down in front of it and they can start working right away, but I also have the control I want without swearing at the computer. Every time I use Xact I appreciate it more and more. I would not hesitate to recommend the program to any scientist who needs to make publication quality graphs from experimentally generated numerical data.|
Previous Article |
|
Next Article |